Cardiovascular Physiology Graphs
|
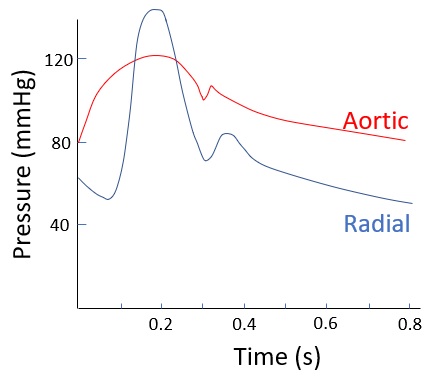
Aortic vs radial waveform |
|
|
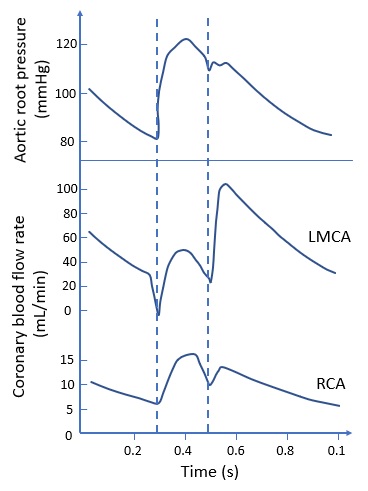
Coronary blood flow |
|
|
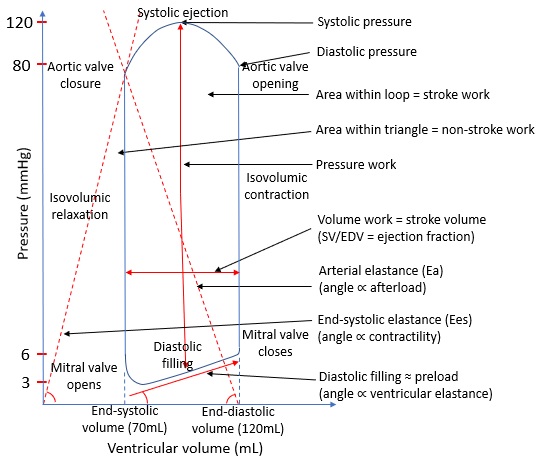
LV pressure-volume loop |
|
|
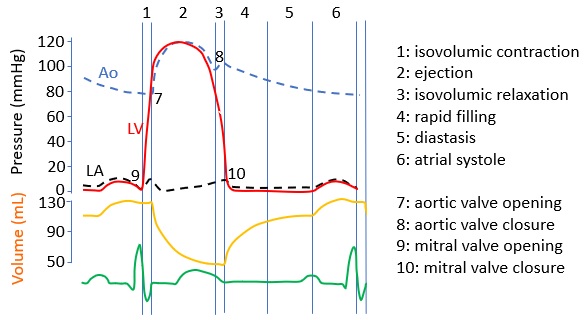
Wigger’s diagramme |
Note the LV and aortic pressure waveforms are frequently drawn incorrectly. |
|
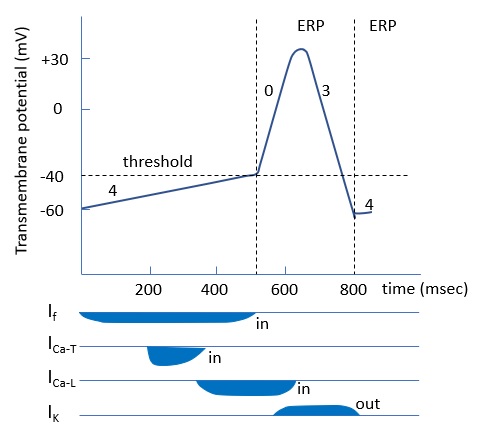
Pacemaker action potential |
|
|
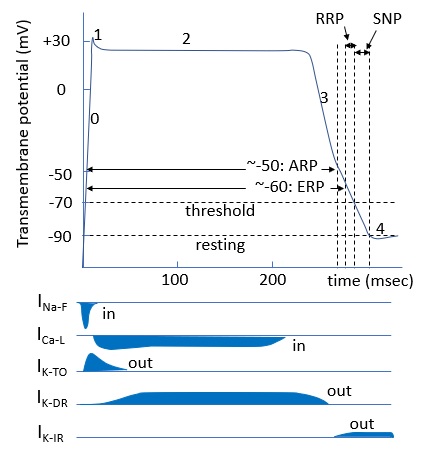
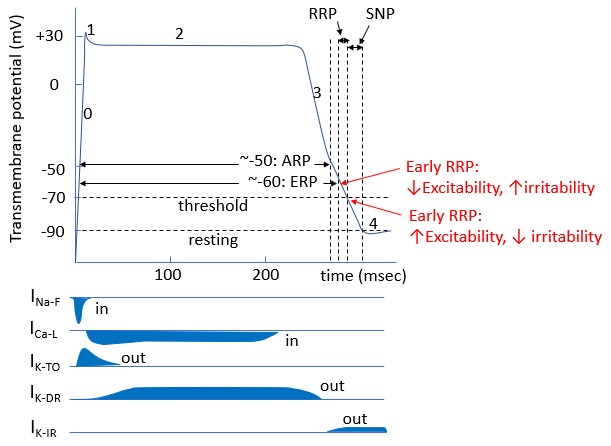
Ventricular myocyte action potential |
|
|
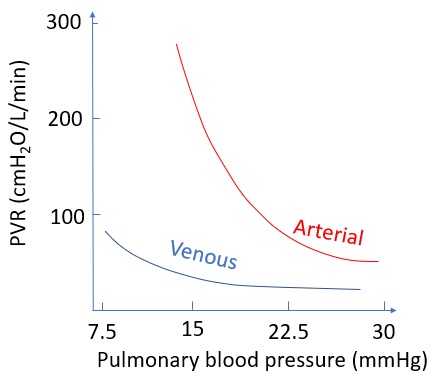
Pulmonary vascular resistance |
|
|
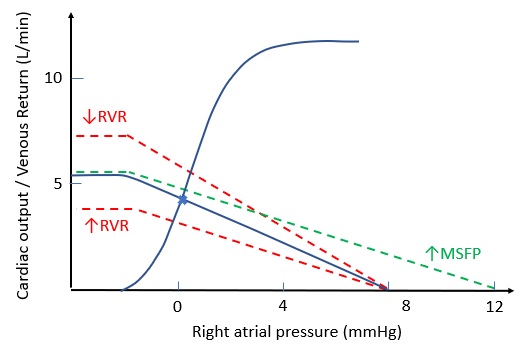
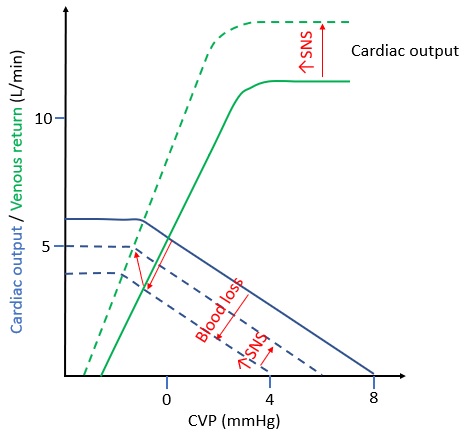
Venous return and cardiac output curves |
|
|
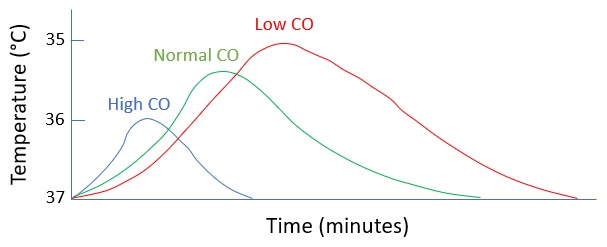
Cardiac output thermodilution |
|