2011B14 Describe the changes in respiratory function tests that occur with long term increases in small airways resistance.
List:
· Intro: small airway resistance
· Test results
Intro: small airway resistance
|
Small airways |
· <2mm diameter · ≥8th generation · <20% total resistance in health due to large total surface area · Silent zone: large increase in resistance before detectable |
|
Air flow physiology |
· Flow rate = (P1 – P2) / airway resistance o Inspiration: PMouth – PAlv o Expiration: PAlv - PMouth · Laminar flow in small airways (small radius, low Reynolds number) o Resistance = (8 x length x viscosity) / (π x radius4) |
|
Small airway obstruction |
· e.g. asthma, COPD · Obstruction in expiration (>inspiration) due to loss of radial traction o ↓Radius -> ↑airway resistance § Variable resistance -> variable alveolar time constants o Earlier and worse dynamic airways collapse (DAC) § ↑Resistance -> ↑Pressure drop -> distal migration of equal pressure point (Pintrapleural = Pairway) · Occurs in forced expiration, +/- in tidal expiration if severe disease o -> ↑RV, ↑FRC, closing capacity, ↓flow rate |
|
Clinical implications |
· Require higher peak airway pressure · Require longer expiratory time · Risk of gas trapping, breath stacking, volutrauma and barotrauma |
|
Test summary |
· Most sensitive in early disease: ↑CV · Most specific to small airways: ↓FEF25-75% · Most quantitative of obstruction: ↓FEV1 (80-100% mild, 50-80% mod, <50% sev), ↓PEFR |
Test results: small airway obstruction
|
Bedside PEFR |
· ↓ (e.g. 4L/s c.f. 8L/s) |
|
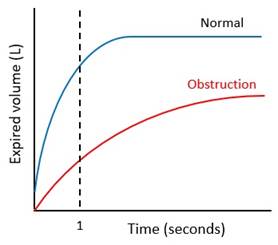
Spirometry |
· ↓FER · ↓FEV1 · ↔↓FVC (less affected)
|
|
Static lung volume testing |
· ↑TLC, ↑FRC, ↑RV · Helium dilution: underestimates FRC, TLC due to gas trapping (+/- bullae) · Whole body plethysmography: accurate |
|
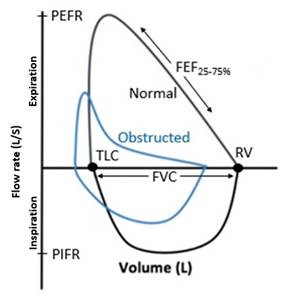
Forced flow-volume curve |
· ↔↓PIFR (affected if severe) · ↓PEFR, scooped-out expiratory curve, ↓FEF25-75 · ↓FVC (less affected) · (↑TLC, ↑RV – unable to measure here)
|
|
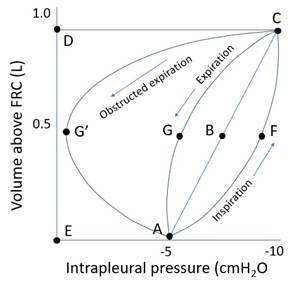
Tidal volume-pressure curve |
· ↑Pressure work · ± Active tidal expiration: if
|
|
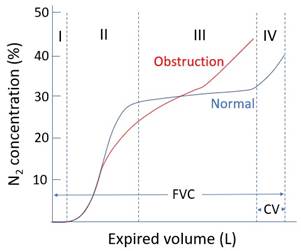
Single breath nitrogen washout |
· ↑Time constant variation -> ↑slope phase 3 o Poorly ventilated alveoli empty late · ↑DAC -> ↑Closing volume (10% in health)
|
|
Arterial blood gas |
· If chronic hypoventilation: o ↑PaCO2 (PACO2 ∝ VCO2/VA) o ↔↓pH (0.03 per mmHg ↑PaCO2) o Renal compensation: ↑HCO3- = 24 + 0.4(PaCO2 – 40) · If closing capacity > FRC: o Shunt -> ↓PaO2 |
|
Exercise testing |
· ↓Max voluntary minute ventilation -> ↓DO2 and ↑respiratory work -> ↓ peak aerobic power |