2019A11 Describe
the principles of how a computer-controlled infusion device
targets and maintains a constant effect site concentration of propofol.
List:
· TCI basics
· Compartment modelling
· Induction
· Maintenance
· Offset
· Model comparison
TCI basics:
|
Aim |
· Achieve target rapidly and with minimal overshoot · Maintain target with minimal variability |
|
Device |
· Pump + syringe · User interface · Microprocessor |
|
Set up |
· Enter patient age, weight +/- height, sex · Enter desired Cpt or Cet (usually 1-8mcg/mL) |
|
Functioning |
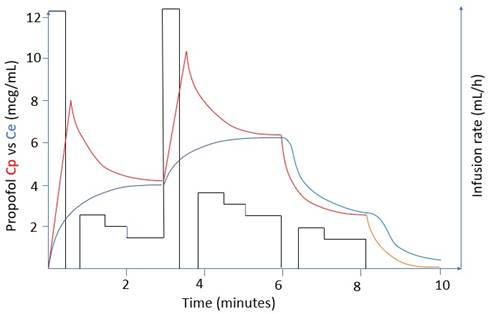
· Initial loading dose · Continuous infusion with q10 second rate adjustment · Desired concentration reached within 30-60 seconds · Rate increase: further bolus then increased infusion rate · Rate decrease: pause then decreased infusion rate · Allow overshoot and undershoot of Cpt if targeting Cet |
|
Graph |
|
TCI compartment modelling:
|
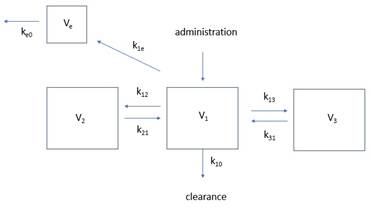
Diagramme |
|
|
Cp (V1) |
· Small number of healthy volunteers · Propofol infusion at various rates for various duration · Serial blood sampling -> chromatography · Plot Cp vs time · Non-linear regression analysis -> tri-exponential decay curve, rate constants, compartment volumes
|
|
Ce (Ve) |
· Cannot measure directly · Derived from relationship between Cp and EEG data · Comprises: o Time for Cp-Ce equilibration (some delay) § i.e. pharmacobiophasics: ∆Ce/dt = k1eCp – ke0Ce o Time for drug-receptor interactions (minimal delay) § i.e. pharmacodynamics: E = E0 + (Emax x Ceγ) / (EC50 + Ceγ) |
|
Limitations |
Fundamental: · Simplification of body composition · Failure to model intravenous induction · Inability to measure Ce Logistical: · Processor maximum rate 1200mL/h · Inability to identify line disconnection Kinetic: · V1: ∝ blood volume (↑ in pregnancy, ↓in haemorrhagic shock) · V2: ∝ musculature (↑ in athletes) · V3: ∝ adiposity (↑in obese) · Inter-compartmental rate constants: ∝ cardiac output (↓ in shock) · Elimination rate constant: ∝ clearance (↓ in liver failure) Dynamic: Highly variable Cp50: · Receptor polymorphism · Use of adjuvants |
Induction:
|
TCI induction kinetics |
· Poorly modelled · Loading dose = Cpt x VDC · At 70kg, VDC 0.45L/kg, Cpt 4mcg/mL, dose = 126mg · Infusion rate (Q) max 1200mL/h in most machines |
|
Alternative induction kinetics |
Time to LOC ∝ peak Cp / time to peak Cp
(A) Peak Cp ∝ · Dose size · Speed of injection · 1/Cardiac output · 1/Central blood volume (Central blood volume ∝ total blood volume) · Speed and extent of recirculatory second peak (important if bolus is slow) (B) Time to peak Cp ∝ · 1/Cardiac output (note contradictory effects of cardiac output) · 1/Distance from injection site to heart |
Maintenance:
|
|
· Q ∝ distribution x metabolism |
|
Early |
· Early: high Q e.g. 100mL/h (distribution +++ metabolism ++) |
|
Later |
· Later: slow Q e.g. 50mL/h (metabolism ++ distribution +) |
|
Steady state |
· Steady state: Css (mg/mL) = infusion rate (mg/min) / clearance (mL/min) |
Offset:
|
Distribution phase |
· Cpt ∝ 1/(distribution x metabolism); rapid ↓Cpt |
|
Terminal elimination phase |
· Cpt ∝ redistribution/metabolism; slower ↓Cpt |
|
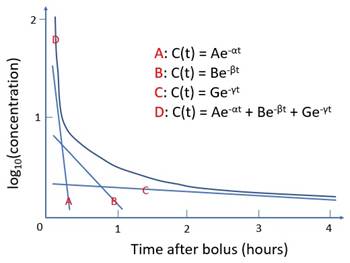
Modelling |
· Multi-exponential decay curve (C = Ae-at + Be-bt + Ge-gt) |
|
Emergence |
· Estimated to occur at ~1mcg/mL · Highly variable |
Model comparison:
|
|
Marsh |
Schnider |
|
Inputs |
Age (>16 only as a qualifier) Weight (adjust in obesity) |
Age
Height Calculates lean mass Weight |
|
Fixed |
Rate constants ke0 (0.26 or 1.2) |
V1, V3 k13, k31 ke0 (0.456) |
|
Variable |
Volumes (by total mass) |
V2, k12, k21 (by age) k10 (by age, lean mass) |
|
Compartment sizes (at 70kg) |
V1 16L V2 30L V3 230L |
V1 4.27L V2 32L V3 230L |
|
Induction dose |
Much higher |
Much lower |
|
Maintenance rate |
Bit higher |
Bit lower |
|
Better setting |
Plasma target |
Effect target |
|
Better patient |
Young + robust |
Old + frail |
Feedback welcome at ketaminenightmares@gmail.com