2020B11 Using
opioids as examples describe and illustrate with graphs what you understand by
the terms
potency, efficacy, partial agonist, competitive antagonist, therapeutic index.
List:
· Definitions
· Graphs
Definitions:
|
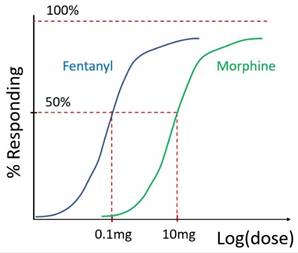
Potency |
· Measure of dose (or concentration) of drug required to produce a given effect · Ratio of ED50’s gives relative potency (also ratio of TD50’s or LD50’s) · It’s the main determinant of dose |
|
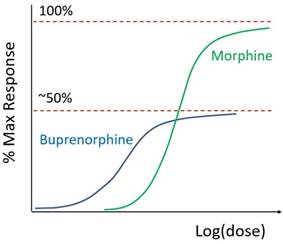
Efficacy |
· The max receptor response achievable by a drug; comprises o Affinity: how likely it is to bind o Intrinsic activity (IA): propensity to activate the receptor once bound |
|
Full agonist |
· IA = 1 · High affinity for active conformation |
|
Partial agonist |
· 0 < IA < 1 · Usually comparable affinity for both active and inactive conformation |
|
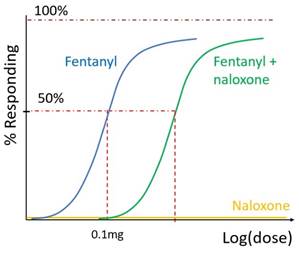
Competitive antagonist |
· IA = 0 · Affinity for active/inactive at same ratio as natural state of flux · Prevents access of endogenous ligand to active site · No change to maximal response. |
|
Inverse agonist |
· -1 < IA < 0 · High affinity for inactive conformation, reduces constitutive receptor activity |
|
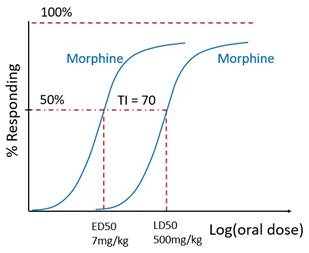
Therapeutic index |
· LD50:ED50 (animals) or TD50:ED50 (humans), where o ED50 = median effective dose o TD50 = median toxic dose o LD50 = median lethal dose · Indicator of drug safety for clinical use. |
Graphs:
|
Potency |
(population quantal log dose-response curve) |
|
Partial agonist / efficacy |
(individual graded log dose-response curve) |
|
Competitive reversible antagonist |
(population quantal log dose-response curve) |
|
Therapeutic index |
(population quantal log dose-response curve) |
Feedback welcome at ketaminenightmares@gmail.com