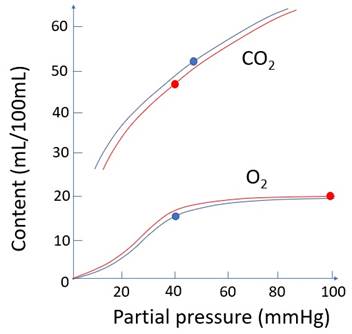
2019B12 Draw the oxygen-haemoglobin and carbon
dioxide-haemoglobin dissociation curves
on the same axes (content vs. partial pressure). Compare and contrast these two
curves.
List:
· Graph
· Table of normal values
· Table of comparison
Normal values:
|
|
Oxygen |
Carbon dioxide |
|
Pa (mmHg) |
100 |
40 |
|
Ca (mL/100mL) |
20 |
48 |
|
Pv (mmHg) |
40 |
46 |
|
Cv (mL/100mL) |
15 |
52 |
|
a-v difference (mL/100mL) |
5 |
4
HCO3- 60% Carbamino 30% Dissolved 10% |
|
Arterial storage |
Hb-bound 98.5% Dissolved 1.5% (∝ partial pressure) |
HCO3- 90% Carbamino 5% Dissolved 5% (∝ partial pressure) |
Curve comparison:
|
|
Oxygen |
Carbon dioxide |
|
Shape |
Sigmoid (law of mass action + co-operative binding) |
Linear |
|
Slope |
Shallower -Large a-v difference in pO2 -Large ↓PaO2 in shunt |
Steeper -Small a-v difference in pCO2 -Small ↑PaCO2 in shunt |
|
Shift |
Right shift -> ↓affinity if: -↑H+, ↑pCO2 (Bohr effect) -↑[2,3-DPG] -↑Temp |
Left shift -> ↑affinity if: -↓SO2 (Haldane effect) |
|
Upper section
-Implication for shunt |
Flat
-↑VA and ↑PiO2 cause minimal improvement in oxygenation |
Linear
-↑VA easily restores ventilation |
Feedback welcome at ketaminenightmares@gmail.com